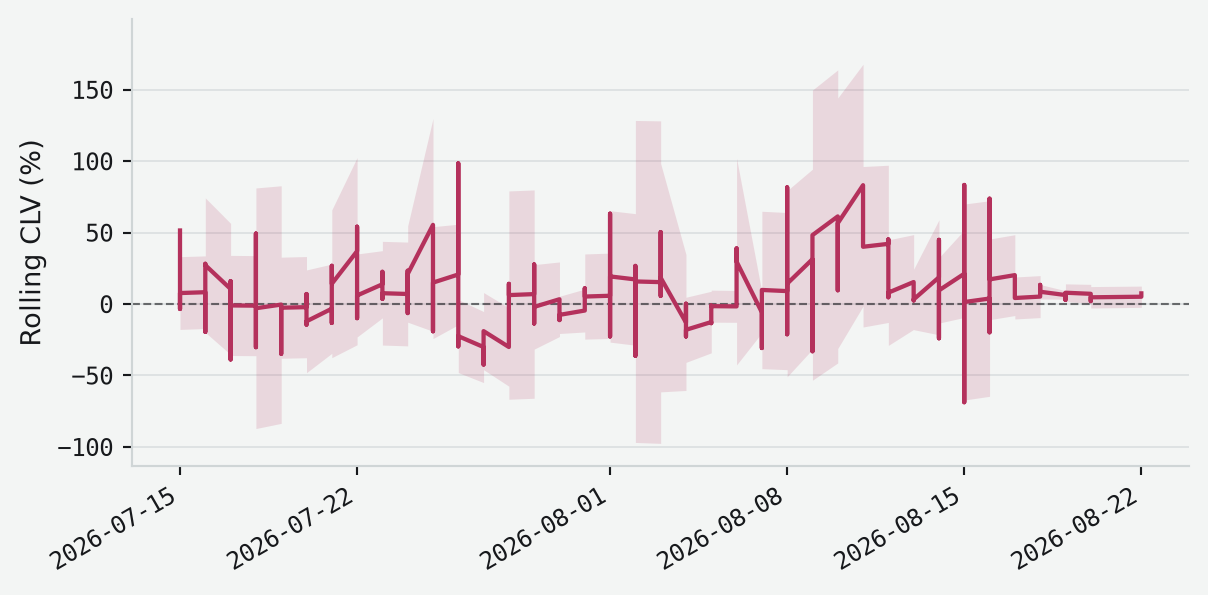
Rolling closing line value
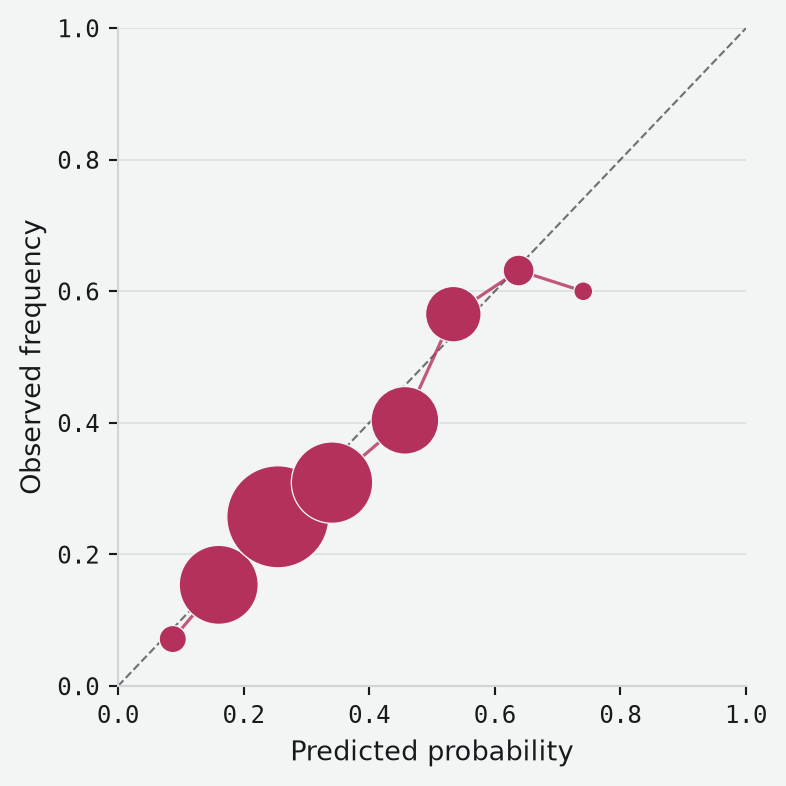
Calibration
Summary
| Metric | Value |
|---|---|
| Beat-close rate | 62.2% (1162/1868) |
| Mean CLV (± SE) | +8.05% (± 1.30%) |
| p-value (vs. 50% null) | 0.0000 |
| Metric | Value |
|---|---|
| Win rate | 32.1% (475/1482) |
| Log loss | 0.581 |
| Brier score | 0.198 |
Does the edge survive to kickoff?
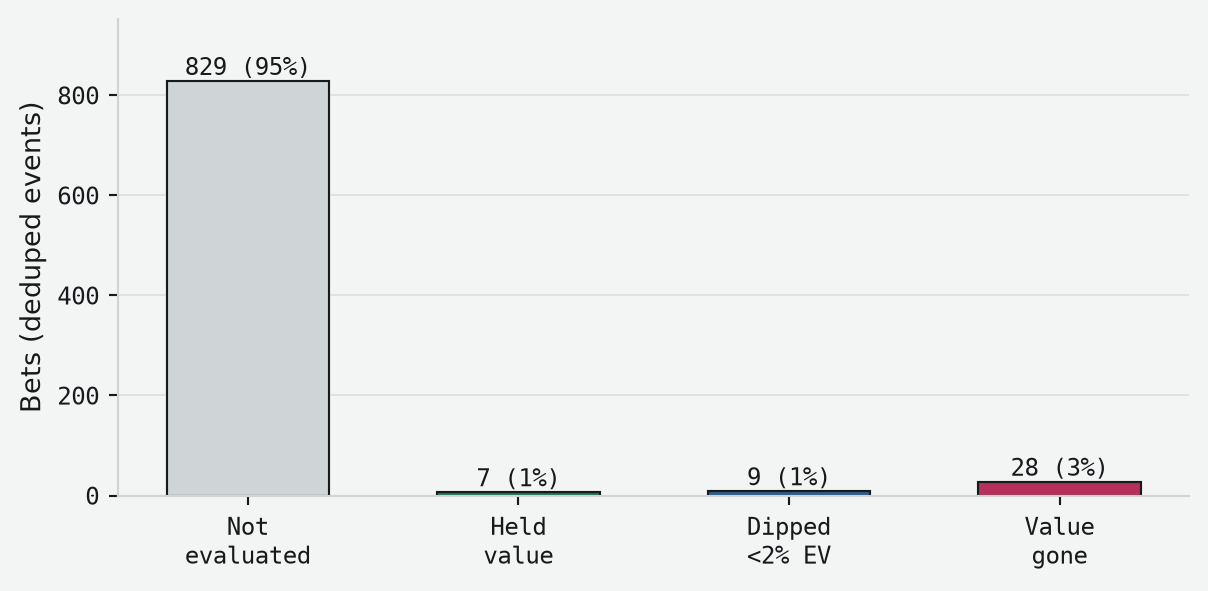
The bot re-checks every logged bet’s EV against live odds up to kickoff. Two sticky flags come out of that: a bet is marked once its EV ever dips under 2% (the bar it had to clear to get logged at all), and again, separately, if it ever falls to near-zero — no realistic edge left. Once set, a flag stays set even if EV recovered later, so this measures whether the edge ever disappeared, not just where it ended up. Only re-checks under the corrected formula (n = 1034) count here — bets re-checked before that fix landed are excluded, since that version conflated EV decay with the soft book’s own price movement rather than Pinnacle’s.
CLV by decay bucket
Every corrected-formula bet falls into exactly one bucket: never flagged, dipped under the 2% EV barrier, or dipped further and confirmed value-gone by kickoff. The table below repeats the closing-line-value stats for each bucket separately, so the flag’s actual relationship to CLV is visible directly instead of inferred from a single filtered comparison.
| Bucket | n | Beat-close rate | Mean CLV (± SE) | p-value |
|---|---|---|---|---|
| No flag | 351 | 72.6% (255/351) | +8.41% (± 0.61%) | 0.0000 |
| Under 2% EV | 181 | 84.0% (152/181) | +8.75% (± 0.64%) | 0.0000 |
| Value gone | 502 | 62.4% (313/502) | +3.92% (± 0.42%) | 0.0000 |